
|
|
|
|
Home :: CAICaculation :: Introduction :: Screenshots ::
Literature :: Links ::
Download ::
Contact & Privacy Policy |
|
|
Bioinformatic tools from our team: |
|
|
|
|
|
JCat was published in NAR (Nucleic Acids Research). |
| Screenshots |
| In this example the CodonUsage of the gene 'anr' from Pseudomonas aeruginosa was adapted to Bacillus subtilis. |
| The first screenshot shows the Codon Usage in B. subtilis before the codon Adaptation: |
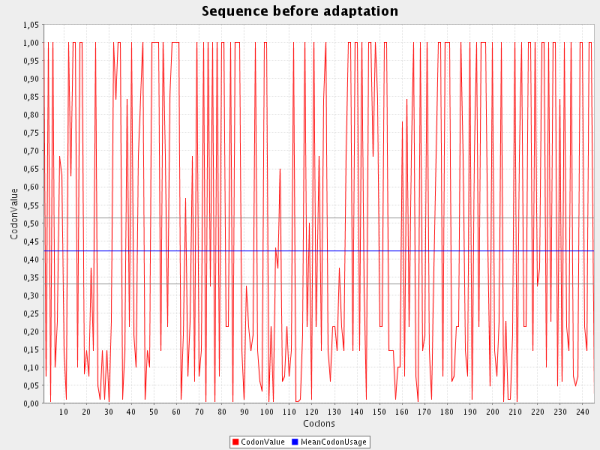 |
| The red line shows the Codon Usage for each codon present in the gene. The blue line depicts the mean Codon Usage in B. subtilis which was calculated for each known gene of this organism. The grey lines above and below the blue line mark the standard deviation for this mean codon usage in the selected organism. |
| The second screenshot shows the adapted Codon Usage for this gene in B. subtilis: |
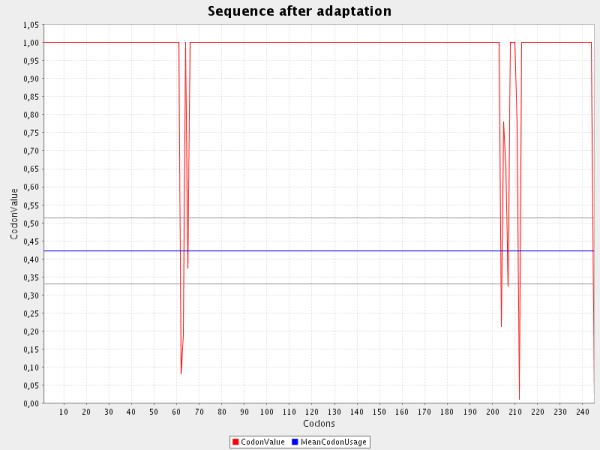 |
| As you can see nearly all codons were shifted to the value 1.0 which is the maximum value for codons. Some codons between 50 and 60 and between 200 and 215 do not reach the value 1.0. Due to the "Avoid rho-independent transcription terminators"-Option in the form some codons which are considered as optimal are substituted by non-optimal codons in order to avoid these structures. Another reason for a "non-optimal" codon adptation may occur if the "Avoid Cleavage Sites of Restriction Enzymes"-Option is selected. A cleavage site of a specified restriction enzyme is also deleted by using non-optimal codons. |
| The third screenshot shows an optimal codon adaptation for a prokaryotic organism: |
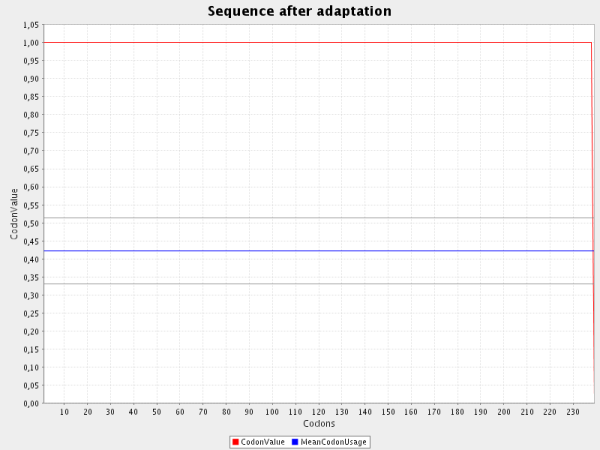 |
| Optimal codons of eukaryotes do not reach values of 1.0 because of a correction factor that takes codon distribution into account. For details see the literature section. |

© 2004-2023 Institute of Microbiology, TU Braunschweig | Created by Andreas Grote